EMR machine learning with R & spark
Amazon EMR is a distributed computing service through AWS cloud virtual machine cluster, which can be used to analyze and process massive data. EMR clusters take advantage of Hadoop’s open source framework management, allowing users to focus on data processing and analysis without spending time worrying about Hadoop cluster configuration, management and optimization, or worrying about the required computing power.
When researchers train machine learning or deep learning models, a huge data set and multi-layer algorithms make the model training too slow.
For this reason, AWS EMR service can be combined with Spark memory processing architecture to allow researchers to complete their data analysis work in a very short time.
Scenario
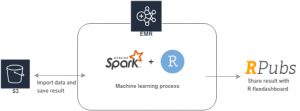
This lab introduces how to use R studio to control Spark in AWS EMR service and train multiple machine learning models to find important factors affecting white wine rating. In this dataset, the white wine is rated on 1 to 10 scale, and there are 12 possible factors may affect this rating: sugar, PH, alcohol, and the various acidity content in the wine. What’s interesting is how to find important factors in so many ingredients and make the judgment beforehand clearer and simpler.
In this lab we use four supervised learning models: decision tree, linear model, random forest, and naive Bayes in Rstudio to find important features that affect the white wine rating.
Rstudio is a R integrated Development environment familiar to data analysts, and it is often used for statistical analysis. Data analysts can quickly run some data analysis code in cloud without an information engineering background.
Finally, we use R flexdachboard to show our machine learning results, and upload this results to Rpubs.
Step by Step
First, we set up a secure connection environment that can open the R studio.
-
In EC2 Service, create Security Group and configure the security group according to the following value:
-
Security group name: EMR Security Group
-
Description: Security for the EMR
-
VPC: No VPC
-
-
In Security group rules, select Inbound and Add Rule. Configure the access rule with the following values:

Launch EMR cluster
In this section we will create an EMR cluster on the AWS console and deploy the required software versions and security settings.
-
In the AWS Management Console, on the service menu, click EMR.
-
In Create Cluster choose Go to advanced options.
-
In Step1: Software and Steps: for Release, choose EMR 5.3.0 and check the box Spark2.1.0.
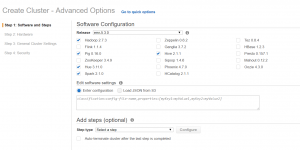
- Choose m4.large instance and check the spot box.

-
In General Options page, type Cluster name as My cluster, and choose the S3 bucket that you want to store some log information.
-
In Security Options page. Select the key pair and EMR security group you created. In permissions, select Custom and change EC2 instance profile to mylab_EMR_role.
Due to insufficient permissions in default role, we need to create a role, in which we attach:
- AmazonEC2FullAccess
- AmazonElasticMapReduceFullAccess
- AmazonS3FullAccess
For more details about create role process, see: AWS Documentation: Creating IAM Roles.
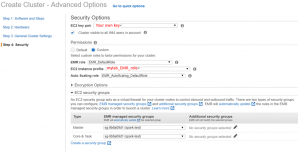
- After confirming that all Settings are completed, click Create cluster.
It may take some time to launch an EMR cluster. If the status is “waiting”, it means you have successfully opened.
Set Rstudio environment
Choose the EMR cluster you just built and use the specified security group key pair (.pem key) to connect Master public DNS of EMR cluster via SSH, then paste the following code on the operating interface of the EC2 master instance:
-
Update
sudo yum update sudo yum install libcurl-devel openssl-devel -
Install RStudio Server > We don’t need to worry about the version of rstudio here, just download and install it directly from the following url.
wget -P /tmp https://s3.amazonaws.com/rstudio-dailybuilds/rstudio-server-rhel-0.99.1266-x86_64.rpm sudo yum install --nogpgcheck /tmp/rstudio-server-rhel-0.99.1266-x86_64.rpm -
Make Rstudio User
sudo useradd -m rstudio-user sudo passwd rstudio-user su rstudio-user -
Give permission to yarn
export HADOOP_USER_NAME=yarn -
Create a new directory in HDF
HDF (Hierarchical Data Format) is a file format and corresponding library files designed for storing and processing large volume scientific data.
    hadoop fs -mkdir /user/rstudio-user
    hadoop fs -chmod 777 /user/rstudio-user
R Script
Before this step, connect to the master node IP: 8787 through the browser and log into Rstudio Server using the Rstudio user you just created.
-
Set system environment in R
Sys.setenv(SPARK_HOME="/usr/lib/spark") config <- list() -
Prepare R packages
install.packages("dplyr") install.packages("sparklyr") install.packages("data.table") install.packages("ggplot2") library(dplyr) library(sparklyr) library(data.table) library(ggplot2) -
Install spark and connect to R
sc <- spark_connect(master = "yarn-client", config = config, version = '2.1.0')
Make sure the Spark version in EMR cluster is 2.1.0!
-
Read data from the S3 public bucket and write Parquet files to HDF
Wine <- fread('https://s3.amazonaws.com/ecv-training-jj-v/wineQualityWhites.csv')

Wine`$`quality<-as.factor(Wine`$`quality)

Wine<-Wine[,-1]

Wine_tbl <- copy_to(sc, Wine)

spark_write_parquet(Wine_tbl, path="/user/rstudio-user", mode="overwrite", partition_by = "dt")
Parquet is a high-performance column storage file format, which is better than CSV file, it can query data quickly.
-
Prepare training and testing data
#Transform our dataset and then partition into 'training' and 'test'.

Wine_partitions <- Wine_tbl %>%
  sdf_partition(training = 0.7, test = 0.3, seed = 10997)
Start machine learning
In the following case, we used the white wine data set to analyze the important feature affecting white wine rating.
-
Build some machine learning models
#Set independent and dependent variables ml_formula <- formula(quality ~ fixed_acidity + volatile_acidity + citric_acid + residual_sugar + chlorides + free_sulfur_dioxide+total_sulfur_dioxide+ density + pH + sulphates + alcohol) #Linear Model ml_lm <- Wine_partitions$train %>% ml_linear_regression(ml_formula) #Random Forest ml_rf <- Wine_partitions$train %>% ml_random_forest_classifier(ml_formula) #Naive Bayes ml_nb <- Wine_partitions$train %>% ml_naive_bayes(ml_formula) #Desision Tree ml_dt <- Wine_partitions$train %>% ml_decision_tree(ml_formula) -
Feature Importance
ml_models <- list( "Linear" = ml_lm, "Decision Tree" = ml_dt, "Random Forest" = ml_rf, "Naive Bayes" = ml_nb ) feature_importance <- data_frame() for(i in c("Decision Tree", "Random Forest")){ feature_importance <- ml_tree_feature_importance(ml_models[[i]]) %>% mutate(Model = i) %>% rbind(feature_importance, .) } feature_importance %>% ggplot(aes(reorder(feature, importance), importance, fill = Model)) + facet_wrap(~Model) + geom_bar(stat = "identity") + coord_flip() + labs(title = "Feature importance", x = NULL) + theme(legend.position = "none") -
Model Comparison
n <- 10

format_as_character <- function(x){
  x <- paste(deparse(x), collapse = "")
  x <- gsub("\\s+", " ", paste(x, collapse = ""))
  x
}

format_statements <- function(y){
  y <- format_as_character(y[[".call"]])
  y <- gsub('ml_formula', ml_formula_char, y)
  y <- paste0("system.time(", y, ")")
  y
}


ml_formula_char <- format_as_character(ml_formula)


all_statements <- map_chr(ml_models, format_statements) %>%
  rep(., n) %>%
  parse(text = .)


res <- map(all_statements, eval)


result <- data_frame(model = rep(names(ml_models), n),
                 time = map_dbl(res, function(x){as.numeric(x["elapsed"])}))


result %>%
  ggplot(aes(time, reorder(model, time))) +
  geom_boxplot() +
  geom_jitter(width = 0.4, aes(color = model)) +
  scale_color_discrete(guide = FALSE) +
  labs(title = "Model training times",
   x = "Seconds",
   y = NULL)
Save R.data
To present the results to R flexdashboard, we save the analysis directly as R.data. R.data can include different data format, can store functions or analysis results and quickly read by R.
Firstly, run R script below:
save(feature_importance,Wine,Wine_tbl,ml_dt, ml_nb, ml_rf, ml_lm, file = '/home/rstudio-user/result.Rdata')
Copy this result to S3 by aws CLI:
aws s3 cp /home/rstudio-user/result.Rdata s3://[your bucket name]
Present analysis result to the web dashboard
To save some cost, you don’t have to run this part on AWS EMR. You can run on your local site and share it with the public R community.
Install required packages:
    install.packages("flexdashboard")
    install.packages("markdown")
Run R Markdown in Rstudio:
-
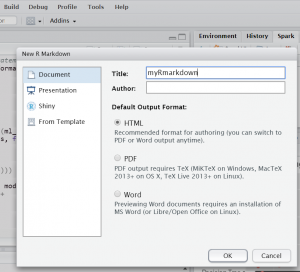
Create a new R Markdown script:
-
Pass the following R markdown script: https://github.com/JellalYu/Sparkling-water-machine-learning-with-R-AWS-EMR/blob/master/flexdashboard_sparkonly.txt
-
Click knit in Rstudio.

- Click publish on the upper right corner.
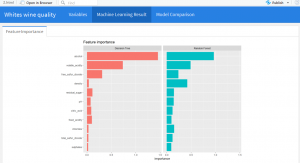
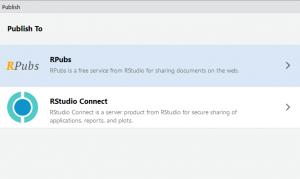
- Publish to RPubs. This is a completely free R community, where you can simply share the analysis results.
Conclusion
Now you have used EMR and R script to build a machine learning model that analyzes the important factors that affect white wine, and publish this results to an open source community and share your insights with other researchers.
Unlike this example, the advantages of EMR clustering are apparent when data is large, or when machine learning models training is time consuming.
EMR can also be well applied in data processes. When enterprises need to deal with huge data, it is a very suitable tool to save costs by distributed computing with HDF and Spark.


